PharmD

Doctor of Pharmacy

Develop the skills necessary to improve patient care and transform the profession of pharmacy.

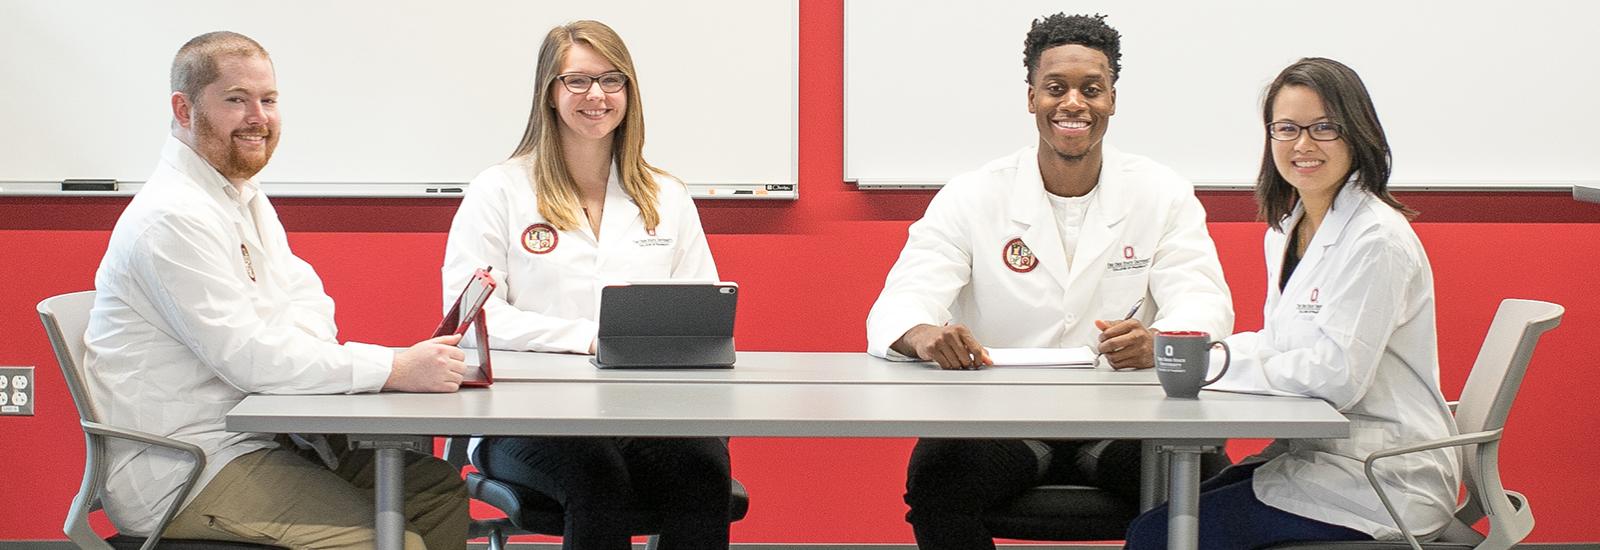
Ohio State's top 5-ranked Doctor of Pharmacy program will train you to become the medication expert on the health care team through our innovative curriculum and access to six other health science colleges and a world-renowned academic medical center steps away.

Video URL

The Ohio State University College of Pharmacy's Doctor of Pharmacy (PharmD) program develops best-in-class care providers who serve as the responsible medication experts in the healthcare delivery system. Graduates of the program are exceptionally well prepared for pharmacy practice and advanced pharmacy education.

Ohio State has seven health science colleges and is located in the center of a comprehensive, nationally-ranked medical center. Student pharmacists have access to world-class faculty members in the College of Pharmacy, where they can learn from scientists and clinicians who are discovering tomorrow’s cures and treating today’s most complex diseases. See for yourself how the Buckeye community comes together to work toward improving the health and lives of others.

Ohio State academic programs are designed to prepare students to sit for applicable licensure or certification in Ohio. If you plan to pursue licensure or certification in a state other than Ohio, please review state educational requirements for licensure and certification and state licensing board contact information at http://go.osu.edu/onground.

Key Outcomes


Licensure Exam Pass Rates for NAPLEX and MPJE scores for the past three years.
Licensure Exam Pass Rates (1)
Year NAPLEX
Ohio State
NAPLEX 
All Graduates from ACPE-accredited programs
MPJE 
Ohio State
MPJE 
All Graduates from ACPE-accredited programs
2023 93% 
(n=116)
79% 
(n=11,537)
91% 
(n=66)
74% 
(n=7,151)
2022 90% 
(n=113)
78% 
(n=13,267)
95% 
(n=77)
77% 
(n=8,612)
2021 86% 
(n=110)
82% 
(n=14,013)
87% 
(n=87)
79% 
(n=9,178)

Ohio State’s first-time test takers have exceeded the average annual pass rate for ACPE-accredited programs on the North American Pharmacist Licensure Examination® (NAPLEX) and the Multistate Pharmacy Jurisprudence Examination® (MPJE) since 2012.

Chart displaying four-year graduation rates for the past five years.
Graduation Rates
Class of Four-year graduation rate (2) Delayed graduation for personal or academic reasons Dismissed Withdrew for personal or academic reasons
2024 88.9% 4.8% 0.0% 6.3%
2023 88.5% 4.3% 0.7% 6.5%
2022 93.6% 2.4% 0.0% 4.0%
2021 92.1% 0.8% 0.0% 7.1%
2020 96.9% 2.3% 0.0% 0.8%

Third Professional Year Program-Level Assessment Highlights, Class of 2025 (3)


Table Showing Program-Level Assessment Highlights
Percentage of students who passed PLA 3 course (n=115) 100%
Percentage of class passing ≥ 80% of assessments 96%
Percentage of class passing ≥ 90% of assessments: 72%
Percentage of class passing patient communication assessments 100%


How did students pay for Pharmacy School?

(Percentages represent the proportion of the Class of 2024 students who used each type of funding.)

Loans 79%
Scholarships 61%
Family Support 58%
Jobs 52%
Personal Savings 40%
Employer Tuition Assistance
(With or without a future work commitment)
9%
Other
(GI Bill / veterans' educational benefits)
1%


Class of 2024 Post-Graduation Outcomes: May 2024 (n=117) (4)

Residency or Residency/Combined Master's 50%
Employment in a Pharmacy Setting 34%
Fellowship 5%
Seeking a Position 10%
Not Yet Looking For a Position 1%


Residencies 2024: Practice Settings (n=58) (4)

PGY1 Pharmacy Residency (Setting not specified) 64%
PGY1 Ambulatory Care Pharmacy Residency 12%
PGY1 Community Pharmacy Residency 8%
PGY1 Managed Care Pharmacy Residency 5%
PGY1 / PGY2 Residency + Master's Program 5%
PGY1 Combined Ambulatory / Managed Care / Community Pharmacy Residency 2%
PGY1 Residency + Master’s Program 2%
PGY1/PGY2 Pharmacotherapy Residency 2%


Employment 2024: Practice Settings (n=40) (4)

Community Pharmacy 85%
Hospital Pharmacy (Inpatient or Outpatient) 8%
Nuclear Pharmacy 2%
Clinical Pharmacy 2%
Long-term Care Pharmacy 2%


Post-Graduation Employment 2024 (4)

Average number of months spent actively seeking employment 1.5 (decreased 0.4 from 2023)
Average number of employers interviewed with 1.2 (decreased 0.4 from 2023)
Average number of job offers received per student 1.2 (decreased 0.1 from 2023)
Average starting salary for full-time employment as a pharmacist, 
May 2024 (excludes residency and fellowship salaries)
$117,483 (increased $1,237 from 2023)


Post-Graduation Placement Satisfaction 2024 (4)

Pleased with post-graduation offers received (excludes graduates still seeking placement) 95%
Satisfied with post-graduation placement (of graduates receiving offers) 95%
Obtained placement in preferred pharmacy setting (of graduates receiving offers) 97%


(1) Pass rates for 2021-2023 graduates reported by National Association of Boards of Pharmacy for the NAPLEX and MPJE. Results are for first-time test takers who are same-year graduates from Ohio State. Examinees who graduated before or after the reported years are not included. Examinees who tested before or after the reported years were not included. Only ACPE-accredited institutions are included in these pass rates. Multistate Pharmacy Jurisprudence (MPJE) exam results reflect test takers testing in state in which their school is located.
 

(2) Four-year graduation rate: Percentage of students from cohort admitted four years prior, not counting students pursuing dual degrees requiring longer time to degree. Percentages of students delaying graduation for other reasons, withdrawing, or dismissed from program are based on number of non-dual-degree graduates from the cohort admitted four years prior.
 

(3) The Doctor of Pharmacy curriculum includes end-of-year Program-level Assessments composed of written and performance-based assessments of critical knowledge and skills. Third-year Program-level Assessments are formative and summative assessments of student readiness to progress to advanced pharmacy practice experiences (APPEs). Results shown here are for Class of 2025 graduates, who completed these assessments in April 2024. Students were required to pass at least 11 of 16 activities to be eligible to begin APPE rotations.
 

(4) Data obtained from OSU College of Pharmacy PharmD Post-Graduation Survey of the Class of 2024, conducted April 11-May 10, 2024. Of 117 graduating students, 117 returned completed surveys (100% response rate). Follow-up surveys will be conducted with respondents seeking positions at 3 months and 6 months after graduation. Due to the nature of the survey, individuals were only required to answer the questions that applied to them, leading to a varying number of responses for each item. 52 of 55 students who applied for jobs reported months seeking employment and number of interviews. 39 reported number of employment offers received. 29 of 40 students receiving or accepting employment offers (72.5%) reported starting salaries.